Are we losing MLB star pitchers at a higher rate than ever? Let’s investigate

This spring has unfortunately brought a familiar sight: Pitchers going down with injuries.
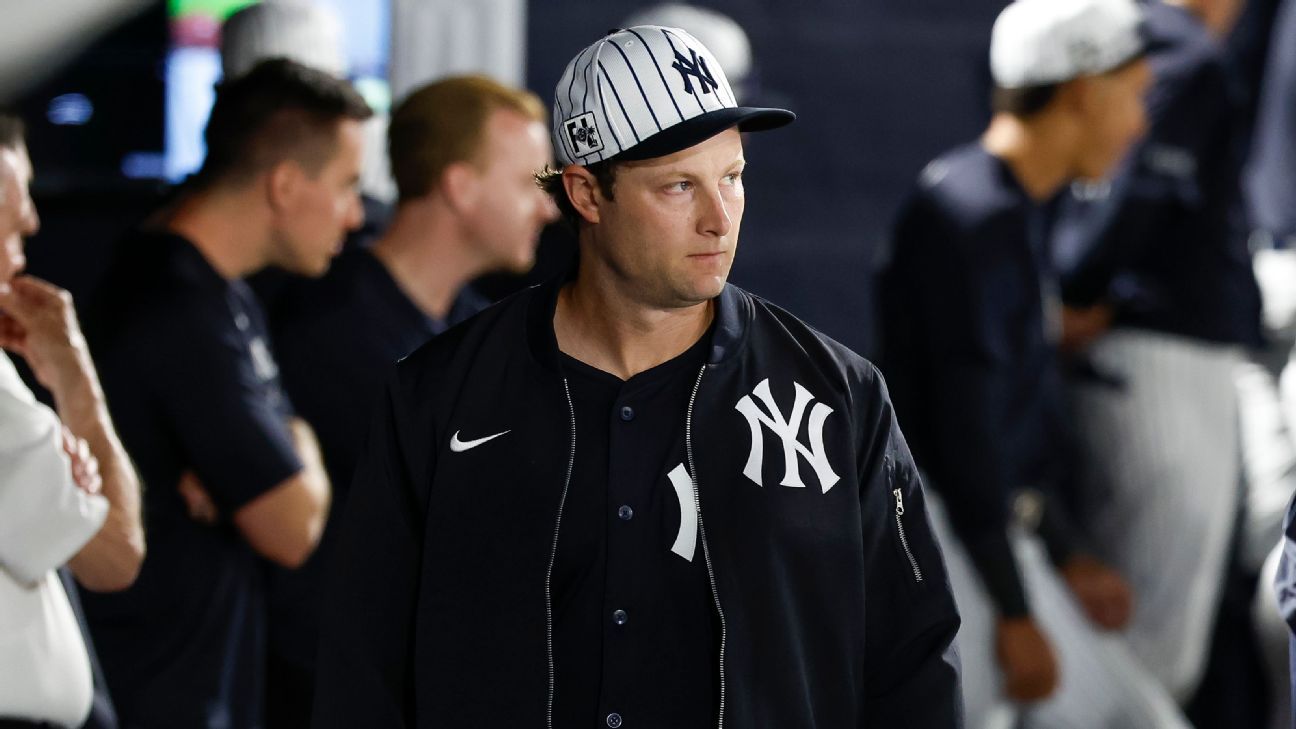
Just this week, it was announced that New York Yankees ace Gerrit Cole will undergo Tommy John surgery and miss the season. The Seattle Mariners’ George Kirby and the Baltimore Orioles’ Grayson Rodriguez, both up-and-coming potential Cy Young contenders, will miss the start of the season with injuries, while Luis Gil, Cole’s teammate and the 2024 American League Rookie of the Year, is out three months with a lat strain.
This is on the heels of a 2024 season that was a devastating one for the health of starting pitchers across the majors. Spencer Strider and Shane Bieber both went down after just two starts. Cole and Blake Snell, the 2023 Cy Young winners, missed time in the first half and combined for 37 starts. Sandy Alcantara, Shane McClanahan, Shohei Ohtani, Julio Urias and Brandon Woodruff didn’t pitch at all. Kodai Senga made one start; Jacob deGrom made three. The venerable trio of Clayton Kershaw, Max Scherzer and Justin Verlander collected just 33 total starts.
These pitchers were all among the best in baseball in recent seasons, from Cy Young winners or contenders to future Hall of Famers — and all were impacted by injuries, causing those around baseball to further speculate about a seeming increase in pitcher injuries over the years.
MLB published a 62-page report in December based on its yearlong study of pitching injuries — not only in the majors but down to the collegiate and youth levels as well — that investigated that increase and identified contributing factors, from increased velocity to more offseason training to pitchers chasing better “stuff.”
“This recent spate of injuries to high-profile pitchers has brought renewed attention to pitcher health,” the report stated. “But these events are unfortunately just a continuation of a long-term trend. In fact, injuries sustained by pitchers in professional and amateur baseball have increased substantially over the past several decades.”
Indeed, the report identified 104 major and minor league pitchers who underwent UCL surgeries in 2010; in 2024, the total had soared to 281 (including 41 major leaguers).
One aspect the study didn’t specifically address, however: Are we losing star pitchers at a higher rate than ever? Was 2024 an extreme outlier season for injuries to aces? To investigate this, we isolated the top 20 starting pitchers from each season since 1971, then tracked their production in WAR and innings pitched in the five seasons following the initial base year of study. We also kept track of how often the members of each group remained top-20 starters over the next five seasons.
This led to a spreadsheet full of data — and, yes, an answer to both our questions. Let’s dig into 10 takeaways from this research, from the most interesting discoveries to additional questions that arose from the data.
(Note: All innings for the strike- or lockout-shortened 1981, 1994 and 1995 seasons have been prorated to a full season, and we excluded 2020 from the study.)
1. The 2024 season was out of the norm in terms of pitcher injuries.
We’ve never seen anything like it, at least going back to the start of my study in 1971. Of the best 20 starters from 2023, only three repeated as a top-20 starter in 2024: Zack Wheeler, Logan Webb and Corbin Burnes. A couple others like George Kirby and Tanner Bibee had good seasons — just not good enough to crack the top 20 — but most of the 2023 group fell off due to injuries.
Any group of pitchers coming off good seasons would be expected to pitch fewer innings the following season — after all, they were good in part thanks to their health. In every year of our study, each group of pitchers combined for fewer innings the following season. But the drop from 2023 to 2024 was extraordinary, from 3,356 innings to 2,075 — just 58.5% of the 2023 total. Here are the five biggest year-to-year percentage declines in innings for the top-20 pitchers:
2023-24: 58.5% of previous year’s innings
1989-90: 73.5% of previous year’s innings
2008-09: 74.5% of previous year’s innings
2018-19: 75.0% of previous year’s innings
2008-09: 77.2% of previous year’s innings
Unsurprisingly, the collective WAR for the top 20 starters from 2023 to 2024 also suffered the biggest year-to-year decline (the historical average since 1971 is 60.2%):
2023-24: 33.5% of previous year’s WAR
1981-82: 36.1% of previous year’s WAR
1979-80: 40.3% of previous year’s WAR
2022-23: 40.7% of previous year’s WAR
2011-12: 46.0% of previous year’s WAR
With two of the worst five seasons in value drop coming in the past two seasons, MLB’s concerns are justified. It’s obviously not good for the sport to see the number of star-level pitchers who have gone down the past couple of years.
2. Today’s best starters aren’t as valuable as past top starting pitchers.
Whether we’re looking at 50 years ago or 10 years ago, this holds true. It isn’t surprising since WAR rewards both run prevention and volume — and starting pitchers are throwing so many fewer innings than they once did.
In the first five years of the study, 1971 to 1975, the top 20 starters averaged 278 innings per season. That number has been declining ever since, with steep declines especially coming over the past decade, and specifically since the 2020 COVID-shortened season. Even as recently as 2011 to 2015, the best starters still averaged 211 innings per season; that total dropped to 194 in the four-year stretch from 2016 to 2019 (an 8.1% decline) and to just 174 innings from 2021 to 2024 (a 10.3% drop).
As a result, the average WAR for the top 20 pitchers has dropped nearly 25% from the start of the study until now.
(Five-year averages become four-year averages from 2016 on.)
3. Why did pitching totals look so different in the 1970s compared to today?
A few things were going on in those early years:
-
The overall levels of offense, especially in the American League, were low: In 1972, the AL averaged just 3.47 runs per game and hit .239, figures barely above the meager totals of 1968, which had led to changes in the height of the mound and a smaller strike zone.
-
There was much less power up and down lineups: From 1971 to 1975, AL teams averaged 117 home runs per season, while National League teams averaged 113 (the MLB average was 196 in 2023 and 182 in 2024). The balls were also undoubtedly less bouncy (when MLB switched from Spalding to Rawlings baseballs in 1977, offense increased from 3.99 runs per game to 4.47).
-
Pitchers in general didn’t throw as hard — although starters like Nolan Ryan, Jim Palmer and Tom Seaver would fit right in in today’s game. The sport was more contact-oriented, which meant lower pitch counts than we see today.
This all meant it was easier to pitch deeper into games — and pitchers also started more often. Many teams still used four-man rotations in the early 1970s or would regularly use their best starters on three days of rest. From 1971 to 1975, an average of 35 pitchers per season made at least 35 starts. In the past 10 seasons, only three pitchers have started 35 times in a season: David Price in 2016, Jhoulys Chacin in 2018 and Miles Mikolas in 2023.
Despite these enormous workloads, many pitchers from this era still had long, successful, Hall of Fame careers. Though, of course, we forget about all the ones who did get hurt.
Bottom line: The game changed. The modern closer began developing in the 1970s with the likes of Rollie Fingers, Goose Gossage and Bruce Sutter. Teams emulated the success of the Los Angeles Dodgers, who had relied on using a stable five-man rotation. As offense increased — and then soared in the 1990s with steroids, livelier baseballs and smaller ballparks — it became much harder to go deeper into games, and innings pitched slowly decreased before completely bottoming out in recent years.
4. Pitcher attrition was constant until recently, when value dropped substantially.
To study this, let’s consider the base year and how many innings and WAR that group produced five years later. We’ll make adjustments for shortened seasons in 1981, 1994, 1995 and 2020. The historical averages from 1971 through 2019 for five years down the road are 54.9% of the original innings and 32.1% of WAR.
Here are the rolling averages:
So the group from the early 1970s was a little more durable and effective than the overall average, but the group of star pitchers who came up in the late 1980s and early 1990s — Roger Clemens, Greg Maddux, Randy Johnson, to name a few — actually held their value a little better.
In general, pitcher attrition was fairly consistent until the past decade or so. You can see that the most recent group ranks at the bottom in both percentage of innings and percentage of WAR. Top starters from the 2016-19 era who produced little or no value in 2024 include not only Bieber and deGrom but guys like Stephen Strasburg, Corey Kluber, Mike Clevinger, Patrick Corbin and Madison Bumgarner.
As mentioned, the MLB report cited the changes in recent years as probable cause for the increase in injuries (which certainly affects the numbers we’re seeing here) — increased velocity, offseason workout regimens, chasing better stuff. I would note that chasing better stuff often means incorporating a new pitch or pitches.
Former ESPN analyst Dave Campbell, who played in the 1970s, once told me that many of the best starters of that era basically relied on two plus-plus pitches: Steve Carlton had a fastball and slider; Nolan Ryan had a fastball and curveball; Bob Gibson was fastball-slider, as was Tom Seaver. He said what made Pedro Martinez rise to a new level of domination at his peak in the late 1990s and early 2000s was having three plus-plus pitches.
Now starters are using four and five or even six different pitches, all to improve their ability to induce more swing and miss. Many go to pitching labs in the offseason to develop a new pitch, whereas pitchers used to rest in the offseason, like Gaylord Perry, who would go home to his farm in North Carolina. He averaged 315 innings per season from 1967 to 1975 — and then pitched another eight years. Could deploying so many different pitches be a factor in all these injuries?
5. Modern pitchers are more effective on a per-inning basis than ever before.
Check out those above totals for WAR per 200 innings pitched. While the best starters in the early 1970s threw a ton of innings and created more value overall compared to contemporary pitchers, the best starters are now more effective on a per-inning basis, with the two highest eras in WAR per 200 innings coming in 2016-19 (5.7) and 2021-24 (5.6). There’s a reason pitchers are chasing better stuff and different pitches: It works.
Modern analytics are driving this change. There’s now more awareness of the third-time-through-the-order penalty (or, in the 1970s, more like fourth time through the order); starters today have a pedal-to-the-metal approach, knowing they’re not expected to pitch nine innings; and deeper bullpens make it easier for a manager to remove a top starter earlier. Unfortunately, pitching fewer innings and giving more off days between starts has clearly not reduced injuries.
6. What was the single worst season in the study?
The past two seasons top the list for lowest combined WAR. The bottom five:
2023: 87.7 WAR
2024: 90.9 WAR
1984: 99.1 WAR
1983: 100.8 WAR
1979: 101.7 WAR
We know what has happened the past two seasons: Fewer innings means less WAR, and 2024 was an exceptionally tough year for starting pitching injuries, so you had fewer top pitchers helping raise that WAR number. Only eight starters reached at least 5 WAR, tied with 1984 and 1986 for the second fewest in a full season — ahead of only 2023, when just four pitchers reached that mark (the highest total since 1971 is 20 in 1972, 1992 and 2009).
What happened in 1984? In the AL, reliever Willie Hernandez took home the Cy Young Award (Dave Stieb probably should have won, but he won “just” 16 games back in an era when Cy Young voters still focused heavily on wins). In the NL, Rick Sutcliffe won — the only pitcher to win the Cy Young Award while pitching for two teams. His overall ERA was just 3.64, but after Chicago acquired him from Cleveland, he went 16-1 for a surprising Cubs team that won a division title. Rookie Dwight Gooden led the NL with 5.5 WAR, which remains the lowest league-leading figure in a non-shortened season since 1951.
7. What was the single best season?
In terms of both total WAR and most wins, the answer is 1972: The top 20 starters combined for 131.4 WAR (6.6 per pitcher) and 373 wins (18.7 per pitcher).
Leading the way was Steve Carlton, who had one of the greatest seasons of all time, going 27-10 with a 1.97 ERA, 30 complete games and 12.1 WAR for an awful Philadelphia Phillies team that won just 59 games overall. Gaylord Perry went 24-16 with a 1.92 ERA and 10.8 WAR in 342 innings. Knuckleballer Wilbur Wood pitched an astonishing 376 innings and won 24 games. Jim Palmer and Catfish Hunter won 21 games. Nolan Ryan had his breakout season after the New York Mets traded him to the then-California Angels, winning 19 games with a 2.28 ERA and 329 strikeouts. Bob Gibson had a big year. Tom Seaver was in his prime.
Of the top 20 starters, 11 are in the Hall of Fame.
The best seasons in total WAR for each decade:
8. What was the best season in terms of long-term value?
There are different ways to examine this question, but I focused on the immediate five seasons following the base year of study. I simply tracked how often each pitcher remained a top-20 starter in each of the following five seasons: Let’s call this the star quotient.
Even going back to the 1970s, it wasn’t easy to remain a top-level starter year after year. A score of 30, for example, would mean the group of starters produced 30 top-20 seasons over the next five seasons — out of a possible 100, so 30% of the maximum result. Here are the five-year averages for star quotient:
1971-1975: 35.6
1976-1980: 23.8
1981-1985: 24.6
1986-1990: 26.8
1991-1995: 31.0
1996-2000: 36.4
2001-2005: 26.0
2006-2010: 27.2
2011-2015: 31.6
2016-2019: 22.3
So, while 1972 was chock full of eventual Hall of Famers, the best star quotient seasons came in 1995 and 1998, which both clocked in with a score of 44. The top five single seasons in star quotient:
1995/1998: 44
1997: 40
1972: 39
1971/1977/2001: 37
And the five lowest seasons (note that 2019 would be the last season eligible to track):
1979: 12
2004/2019: 16
2016: 17
2007: 18
9. Star quotient scores in recent years are at an all-time low.
If we look at star quotient scores through the years, we can see that great pitching has come in waves. We had that group of Hall of Famers in the 1970s who combined longevity and excellence. The pitchers of the early 1980s — Fernando Valenzuela, Dwight Gooden, Dave Stieb, Bret Saberhagen — weren’t able to reach the same heights, while potential stars like Britt Burns and Mario Soto suffered career-shortening injuries.
The 2000s saw a dip when that next great wave of pitching — from the late 1980s to early 1990s — faded, but late that decade saw the emergence of Kershaw, Verlander, Scherzer and Zack Greinke, not to mention Felix Hernandez, Cole Hamels and David Price. With that group leading the way, the 2012 to 2015 seasons averaged a star quotient score of 33.5.
Now, those pitchers either have faded into retirement or are trying to hang on. The next generation failed to ignite. The 2019 list produced a star quotient of just 16; only two pitchers who ranked in the top 20 that season remained a top-20 pitcher in 2022 — Verlander and Scherzer. Five years later, not a single top-20 pitcher from 2019 ranked as a top-20 starter in 2024.
The trends since 2021 have followed a similar depressing slope. Only two pitchers from that season achieved star status each of the next three years — Zack Wheeler and Corbin Burnes. Only two others achieved star status twice — Ohtani in 2022 and 2023 before his injury and Max Fried in 2022 and 2024 (sandwiched around a 14-start season in 2023). Those who underwent Tommy John surgery: Walker Buehler, Robbie Ray, Wade Miley, Lucas Giolito, Tyler Mahle, deGrom, Alcantara and now Cole.
Including Ohtani’s hybrid Tommy John/brace procedure, that’s nine out of 20 pitchers who blew out their elbow. Three others had other significant injuries. The star quotient score for 2021 through three years: just 15.
So far, 2022 isn’t faring much better, with a star quotient score of 12 in two seasons. The hope here is pitchers like Ohtani, Alcantara and McClanahan can make strong comebacks. Pitchers like Dylan Cease and Aaron Nola were both top-20 pitchers in 2024. Wheeler, Webb and Fried are still going strong.
Still, the general drift remains: more injuries, fewer reliable pitching stars.
10. The lowest star quotient season of 1979 deserves special mention — and might provide a lesson for modern pitchers.
OK, the historian in me wants to examine what happened in 1979. Certainly, many of those early-1970s stars had gotten older — many were still pitching, just not quite as effectively. The 12 star quotient points came from:
-
Dennis Eckersley: 2 (1982, 1984)
-
Jack Morris: 2 (1981, 1983)
-
Rick Reuschel: 2 (1980, 1981)
-
Tommy John: 2 (1980, 1982)
-
Steve Rogers: 2 (1980, 1982)
-
Phil Niekro: 1 (1984)
-
Nolan Ryan: 1 (1981)
Now, a different set of top-20 pitchers would have yielded at least slightly different results. I didn’t include Carlton, for example, and he would go on to win Cy Young Awards in 1980 and 1982. He ranked third in the majors in strikeouts that year and FanGraphs ranked him 15th overall, but he ranked just 65th in Baseball-Reference WAR and 38th among qualified pitchers in ERA. He wasn’t really the 65th-best pitcher, but it was hard to justify him as one of the top 20.
The same goes for Bert Blyleven, who ranked 26th in FanGraphs WAR and 40th in Baseball-Reference. He had been a top pitcher throughout the 1970s and would go on to enjoy many more good seasons in the 1980s, but he simply didn’t pitch at a star level in 1979.
Is there a lesson to draw from 1979? The game had changed in just seven years from that 1972 season. Modern bullpens began to evolve. Offense was increasing. While knuckleballer Niekro threw 342 innings, he was the only 300-inning pitcher that year — and just 14 pitchers reached 250 innings compared to 27 in 1972 and 32 in 1973. In that vein, the game of 2025 is different from just seven years ago, with the continued emphasis on power hitting and the use of pitching labs to develop pitchers. Just as pitching was harder in 1979 than it was in 1972, pitching is harder in 2025 than it was in 2018.
It’s also true that 1979 just wasn’t a stellar year for starters. The AL Cy Young winner was Mike Flanagan, who won 23 games for the Orioles. He would pitch until 1992, but 1979 was a career year — he was 107-103 the rest of his career. Tommy John and Mike Caldwell were two of the top pitchers that year but were finesse pitchers. Mike Parrott had 5.1 WAR for the Mariners in 1979 but then went 1-16 in 1980. Then there were the injuries. J.R. Richard suffered a stroke in 1980. Dave Frost hurt his elbow. Craig Swan tore his rotator cuff. Rick Langford broke down after Billy Martin pitched him into the ground in 1980 and 1981 (46 complete games in 57 starts).
Maybe that’s the lesson: Pitchers have always gotten hurt.
What does it all mean as we head into 2025?
In recent years, fans and analysts complaining that pitchers don’t throw complete games like the heroes of their youth have become as de rigueur as peanuts and hot dogs at a ballgame. What the numbers arguably bear out, however, is the problem isn’t a lack of innings, but a lack of stars.
The injury crisis means fewer pitching stars than we’ve had in the past 50 years. From Tom Seaver and Nolan Ryan to Greg Maddux and Pedro Martinez to Clayton Kershaw and Max Scherzer, star pitchers have carried the headlines and driven interest in the game for most of its existence. Scherzer, by the way, was a top-20 pitcher every season from 2012 to 2022 — 11 seasons, the longest consecutive stretch in the study.
Right now, we need the next Max Scherzer. Maybe it will be Paul Skenes. Maybe it will be AL Cy Young winner Tarik Skubal. Maybe it will be one of an exciting young group of pitchers to perhaps herald in a new generation: Garrett Crochet, Hunter Greene, Cole Ragans, Bryce Miller, Bryan Woo, Hunter Brown, Roki Sasaki, Yoshinobu Yamamoto, Cristopher Sanchez, Jared Jones and Spencer Schwellenbach, with Strider and McClanahan returning from their injuries. Hopefully, it’s not just one but many of them, as they’re all capable of turning into top-20 pitchers for the foreseeable future.
No, they won’t throw 300 innings in a season like pitchers did in 1972. The injury crisis is certainly real — but so is the talent we see in today’s pitchers. With a little luck, we could even enter another golden era of pitching stars, just like the early 1970s, the 1990s and the early 2010s. It’s time for a new cycle to begin.